Information Disclosure Based on TCFD Recommendations
In recent years, as global warming advances, we have been seeing the concrete impacts of climate change through increasingly frequent heavy rains, typhoons, extreme heat, and other abnormal weather events. Companies face strong demands for environmental measures addressing climate change, including decarbonization and ESG investment, with the impact on corporate management expected to grow even greater. Given this business environment, our Group recognizes that addressing sustainability challenges, including social and environmental issues, is a critical management priority. We have established a Sustainability Policy and will proactively consider these challenges, respond to them in an appropriate manner, and provide specific disclosure about our progress. The TCFD recommendations call for disclosure along four areas: Governance, Strategy, Risk Management, and Metrics and Targets. Our Group will disclose climate-related information in line with these four TCFD recommendation framework areas.
a.Governance
Our Group has established a Sustainability Policy so that we can contribute to a sustainable society from environmental, social, and economic perspectives while enhancing our corporate value. We have identified business material issues and set targets for 2030.
The Board of Directors verifies the appropriateness of our long-term vision, medium-term management plan, annual management policies, and annual plans based on our Sustainability Policy and targets. Through its supervisory authority, the Board requires standing directors and executive officers to ensure effective implementation of initiatives.
The Board of Directors’ role in sustainability management challenges includes:
- ⑴ Approving material issues identified based on the Sustainability Policy
- ⑵ Approving sustainability targets and priority issues deliberated by the Management Committee
- ⑶ Approving the long-term vision based on material issues and 2030 targets
- ⑷ Approving the medium-term management plan based on material issues and 2030 targets
- ⑸ Approving annual sustainability-related plans and budgets
- ⑹ Monitoring plan progress and providing information and guidance to executive officers and relevant departments
- ⑺ Providing guidance on other important sustainability matters
Promotion Structure

b.Strategy
We evaluated the importance of climate change risks and opportunities from the perspectives of likelihood and magnitude of impact. For high-priority risks that could be quantified, we calculated the financial impact on our Group by the year 2030 (short-term), 2050 (medium-term), and 2100 (long-term).
Our Group is investigating and implementing countermeasures to mitigate particularly important risks and seize opportunities, confirming that we have sufficient resilience against both 1.5°C/2°C and 4°C scenarios.
-
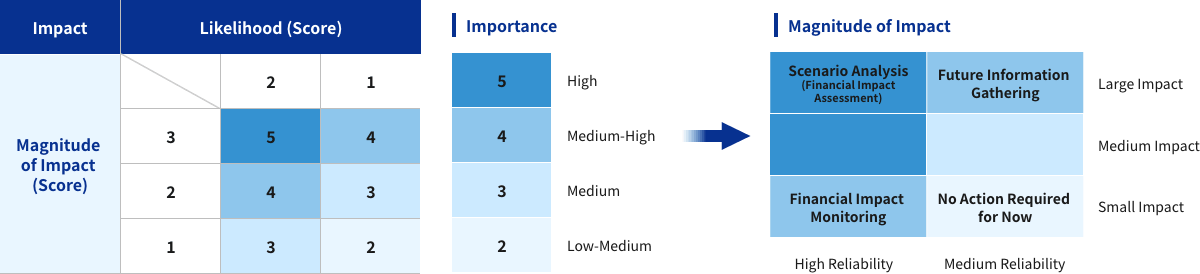
Importance Evaluation Method
We determine importance using a matrix that evaluates Likelihood (based on external reports, past impacts, and our plans/policies) against Magnitude of Impact (for risks: severity of impact, affected departments, scope of impact; for opportunities: market size, production capacity, competitive advantage).
-
Scenario Analysis and Response Measures
Key Risks & Opportunities Business Impact Business Division
※1Importance※2 Timing of Impact Occurrence Relationship with
Material Issues※3Key Response
Measures1.5℃/2℃
Scenario4℃
ScenarioTransition Risks Policy & Regulatory Risks Expansion of carbon taxes/levies and emissions trading systems Increased operational costs in logistics business (outsourcing fees to carriers, emissions trading costs). Logistics Medium-High
★Short-Medium Term (1) - ・Improving logistics efficiency
- ・Promoting CO₂ reduction activities (introducing EV vehicles)
Stricter regulations on adoption of renewable energy and Zero Energy Building (ZEB) conversion Costs will be incurred for installing renewable energy generation facilities and ZEB compliance for company buildings, warehouses, and real estate. All Business
DivisionsMedium-High (1) - ・Introducing renewable energy (installing solar panels)
- ・Actively utilizing renewable energy in real estate
Stricter regulations to increase the use of small electric trucks Business opportunities will be lost as customers demand adoption of environmentally friendly vehicles (electric vehicles (EV), hybrid (HV) trucks, hydrogen vehicles, etc.). Logistics Medium-High (1) - ・Introducing environmentally friendly vehicles (EVs)
Market
RisksGrowing environmental awareness among customers and consumers regarding climate change Business opportunities will be lost as customers’ procurement standards and bid participation requirements become stricter. All Business
DivisionsHigh (1) (5) - ・Promoting environmentally conscious business activities
Physical Risks Acute
RisksIncreased frequency and severity of weather-related disasters such as typhoons, heavy rains, and floods Production delays at client companies (shippers) will lead to decreased storage and warehousing operations, resulting in reduced revenue. Additionally, production delays will create compressed work schedules, increasing labor costs. Logistics Medium-High Medium-Long Term (2) - ・Implementing labor-saving operations
There will be logistics business disruptions due to transportation network failures and compensation payment obligations. We will incur additional fuel and labor costs due to delivery route changes. Logistics High (2) - ・Implementing labor-saving operations
At both company-owned and contracted logistics warehouses, disruption of utilities (electricity, water, gas) and lost sales opportunities will lead to declines in revenue. Logistics
FoodHigh
★(6) - ・Promoting disaster prevention/mitigation and BCP-related measures
Damage to upstream supply chain including rice paddies will affect rice procurement, reducing product procurement and sales volumes, resulting in decreased revenue. Logistics costs will also go up due to changing procurement sources. Food Medium-High (5) - ・Expanding procurement areas and diversifying procurement routes
Acute
RisksIncreased frequency and severity of weather-related disasters such as typhoons, heavy rains, and floods Increased flood risk for company-owned properties will lead to higher insurance premiums and renovation costs for resilience improvements. When flooding occurs, revenue loss from business interruption and repair costs will arise. All Business
DivisionsHigh
★Medium-Long Term (6) - ・Relocating logistics facilities
- ・Promoting disaster prevention/mitigation and BCP-related measures (utilizing hazard maps, installing flood barriers)
Damage to downstream supply chain (client stores) will lead to lost sales opportunities and a decline in revenue. Food High (6) - ・Promoting BCP measures across supply chain companies
Chronic
RisksRising temperatures Changes in suitable production areas and quality decline for agricultural, marine, and livestock products used as raw materials will increase procurement costs and reduce profit margins. Food High (4) (5) - ・Developing new varieties and products based on climate change risks and changing consumer needs
Equipment failures due to rising temperatures in rice mill factory and other facilities will lead to repair costs. Revenue losses will occur during business interruption periods as well. Food High (5) - ・Proper equipment maintenance
- ・Maintenance and renovation
Increased risk of heat stroke and tropical infectious diseases will cause employee health issues and staffing shortages, reducing revenue. Decreased dining-out opportunities will also reduce revenue. All Business
DivisionsMedium-High (6) - ・Implementing labor-saving logistics operations
- ・Thorough health management, promoting telework
Rising sea level Logistics operations at high flood-risk ports will be disrupted, reducing revenue. Logistics
FoodHigh
★(2) (6) - ・Relocating logistics facilities
- ・Promoting disaster prevention/mitigation and BCP-related measures (utilizing hazard maps, installing flood barriers)
Opportunities Market Stricter regulations on reuse and recycling Expanding demand for reverse logistics will create market entry opportunities, leading to the acquisition of new customers and increasing revenue. Logistics Medium-High Short-Medium Term (1) - ・Advancing the 3Rs based on reverse logistics
Products and
ServicesCustomer behavioral changes to reduce greenhouse gas (GHG) emissions Introducing low-GHG vehicles and equipment will attract customers committed to reducing GHG emissions, increasing revenue. Logistics Medium-High (2) - ・Selecting focus areas based on energy mix
Developing low-GHG products will attract customers committed to reducing GHG emissions, increasing revenue. Food High (1) (4) (5) - ・Developing new varieties and products based on climate change risks and changing consumer needs
PR activities highlighting climate change initiatives will improve investor evaluations and increase investment. All Business
DivisionsMedium-High (6) - ・Systematically implementing climate change risk response measures and actively disclosing them (TCFD disclosure, CDP Climate Change response)
Rising temperatures Developing heat-resistant varieties and strengthening partnerships with future rice production areas will enable stable rice procurement, increasing revenue. Food High Medium-Long Term (2) (4) (5) - ・Developing new varieties and products based on climate change risks and changing consumer needs
Quick response to fishing ground changes due to climate change will increase sales opportunities and revenue. Food High (2) (6) - ・Deepening partnerships with suppliers to understand environmental changes
Products and
ServicesIncreased frequency and severity of typhoons, heavy rains, and floods Growing demand for disaster-resilient optimal transportation systems will increase revenue when accommodated by service provision. Logistics Medium-High Medium-Long Term (2) - ・Collaborating with shippers and supply chain players to streamline and advance logistics
Resilience Relocating company-owned data centers and logistics bases to low disaster-risk areas will ensure business continuity and increase revenue. Information,
LogisticsMedium-High (2) (6) - ・Relocating logistics facilities and data centers
Installing renewable energy generation facilities for power outage response will reduce electricity costs and generate power sales revenue. All Business
DivisionsMedium-High (2) (6) - ・Installing renewable energy facilities (solar power generation)
Securing multiple suppliers, adjusting lead times, and optimizing suppliers to address procurement instability will ensure business continuity and increase competitive advantage, leading to more business opportunities. Food High (2) (6) - ・Strengthening supply chain resilience
- ※1 All Business Divisions indicates company-wide impact
- ※2 ★indicates risks with calculated financial impact
- ※3 Numbers correspond to the following material issues in the Management Basic Policy:
(1) Promoting environmentally conscious business activities, (2) Improving product and service quality, (3) Promoting diversity and engagement of human resources, (4) Developing local communities, production areas, and agriculture, (5) Promoting sustainable rice procurement, (6) Deepening corporate governance
-
Scenario Group Definitions
For transition risks, we targeted additional costs from carbon tax introduction; for physical risks, we targeted additional costs and damage from facility flooding during floods and storm surges. Our scenario analysis assumed 1.5°C/2°C and 4°C temperature increases based on climate change-related information from the Intergovernmental Panel on Climate Change (IPCC) and the International Energy Agency (IEA).
Scenario Groups Used
Temperature Increase Band
(Year 2100)IEA
WEOIPCC
RCPIPCC
RCP4°C increase RCP8.5 SSP5 (Fossil-fueled development)-8.5 2°C increase APS (All net-zero declaration countries achieve goals) RCP2.6 SSP1 (Sustainability)-2.6 1.5°C increase NZE (Achieving net zero by 2050) SSP1 (Sustainability)-1.9 Financial Impact Calculations Used Carbon tax introduction Floods, rice Storm surge Global Average Temperature Change from 1850-1900 Baseline
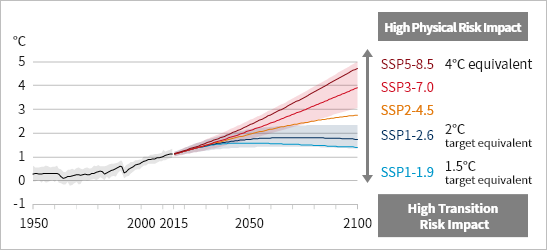
Source: Intergovernmental Panel on Climate Change (IPCC) Sixth Assessment Report (AR6) Working Group I Report Climate Change 2021
-
Impact Assessment
For high-priority, quantifiable risks, we calculated additional costs from carbon tax introduction as a transition risk, and additional costs/damage from facility flooding during floods and storm surges as physical risks.
-
(1) Transition Risks
Based on International Energy Agency (IEA) information, we calculated additional costs from taxes on greenhouse gas emissions from energy consumption at domestic business sites (including consolidated entities). Under the 1.5°C scenario, additional costs increase significantly, with impacts in 2050 estimated at approximately ¥480 million, representing up to about 15% of FY2023 ordinary income.
Risk Scenario Financial Impact
(Amount (millions of yen))Financial Impact
(vs. Ordinary Income (%))Financial Impact
(vs. Sales (%))2030
(Short-term)2050
(Medium-term)2030
(Short-term)2050
(Medium-term)2030
(Short-term)2050
(Medium-term)Carbon tax introduction 1.5°C increase 267.79 478.19 8.41 15.02 0.42 0.74 2°C increase 258.22 382.55 8.11 12.01 0.40 0.59 - ● Calculation Method
Current CO2 emissions x Future carbon tax price - ● Future Carbon Tax Price Scenarios Used
We have adopted the following scenarios from the World Energy Outlook 2023 published by the IEA (International Energy Agency):
・1.5°C increase: NZE Scenario (Net Zero Emissions by 2050 Scenario)
・2°C increase: APS (Announced Pledges Scenario)
- ● Calculation Method
-
(2) Physical Risks
Using future projection data from the Intergovernmental Panel on Climate Change (IPCC), we calculated the additional costs of securing alternative offices needed for business continuity, lost sales and rental income from business interruptions, and asset damage from flooding if our domestic offices, warehouses, and real estate properties suffer flood or storm surge damage. The 4°C increase scenario showed the greatest financial impact, with impacts in 2100 estimated at approximately ¥3.5 billion, representing about 108% of ordinary income.
Risk Scenario Financial Impact
(Amount (millions of yen))Financial Impact
(vs. Ordinary Income (%))Financial Impact
(vs. Sales (%))2030
(Short-
term)2050
(Medium-
term)2100
(Long-
term)2030
(Short-
term)2050
(Medium-
term)2100
(Long-
term)2030
(Short-
term)2050
(Medium-
term)2100
(Long-
term)Flooding at facilities
from floods and storm surges1.5°C increase
(Storm Surges)0 1,067 2,069 0.00 33.52 51.04 0.00 1.65 2.52 2°C increase
(Floods/Storm Surges)37 1,482 2,265 1.16 46.53 71.12 0.06 2.30 3.51 4°C increase
(Floods/Storm Surges)368 2,069 3,450 11.56 64.97 108.36 0.57 3.21 5.35 - ● Calculation Method
Calculating additional costs and damage from natural disasters (future - present)
Additional costs and damage are calculated by determining flood depths at each facility during floods and storm surges using publicly available data, then estimating office replacement costs, sales losses, rental income losses, and asset damage for each location following national calculation methods based on actual flood damage records. - ● Future Flood Depth Scenarios Used
We have adopted the following scenarios from the IPCC (Intergovernmental Panel on Climate Change):
・Floods: RCP scenarios from AR5 (Fifth Assessment Report) (equivalent to 2°C and 4°C increases)
・Storm surges: SSP scenarios from AR6 (Sixth Assessment Report) (equivalent to 1.5°C, 2°C, and 4°C increases)
- ● Calculation Method
-

c.Risk Management
Our Group has established a Risk Management Committee chaired by the President to address risks. This committee handles risk management for the entire Group, including sustainability issues, while developing risk management policies, establishing systems, and monitoring operations. On the operational side, the Head of Corporate Division, who oversees the Corporate Planning Department, is responsible for environmental management strategy.
Risk Management Process
We currently identify and evaluate sustainability-related risks and opportunities across the entire value chain when developing our three-year medium-term management plan and as needed, following steps (1) through (4) below. This process is integrated with the risk management process outlined in our Risk Management Policy, which is based on the Basic Policy on Internal Control System Development approved by the Board of Directors.
-
(1) Material Issue Identification Process
The Corporate Planning Department creates a list of potential issues, and each Company President identifies issues within their value chain. These issues are assessed for both company importance and social importance, with those scoring high on both dimensions identified as material issues for each Company. Material issues are deliberated at management meetings, approved by the President, and then resolved by the Board of Directors. Climate change response is currently included in our material issues.
-
(2) Process for Integrating Material Issues into Management Strategy
First, we develop a three-year medium-term management plan to address material issues. Based on this, the Risk Management Committee determines annual management policies as response measures for each risk. Company Presidents then create annual plans for their respective Companies based on these policies. The appropriateness of the plan is decided upon at management meetings and then approved by the Board of Directors.
-
(3) Implementation and Performance Evaluation Process
Progress and results are evaluated at biannual review meetings attended by the President and full-time directors. Based on these evaluations, the President and full-time directors instruct executive officers to make corrections or improvements. These matters are reported to the Board of Directors as part of the President’s and full-time directors’ execution status of their duties.
-
(4) Review and Revision Process
If significant changes occur in the business environment during the three-year medium-term management plan period, the Risk Management Committee instructs each Company to develop countermeasures. Company Presidents who received these instructions determine response policies and develop plans. The appropriateness of the plan is deliberated at management meetings, approved by the President, and then resolved by the Board of Directors.
d.Metrics and Targets
Our Group has identified environmentally conscious business activities as one of our material issues in our management policy.
We calculate Scope 1-3 emissions following the GHG Protocol and have set a target to reduce GHG emissions (Scope 1 + 2) by 50% from FY2013 levels by 2030 in an effort to reduce our greenhouse gas emissions.
Note that FY2023 emissions include Shokukai Co., Ltd., which we acquired through M&A in FY2023, in our calculation scope.
GHG Emissions from Business Activities
| Category | GHG Emissions (t-CO2) | |||
|---|---|---|---|---|
| FY2022 | FY2023 | FY2024 | ||
| Scope1 | 5,404 | 5,168 | 4,960 | |
| Scope2 | Location- based |
9,894 | 13,479 | 12,652 |
| Market- based |
10,400 | 7,384 | 5,168 | |
| Total (Scope1+2) |
Location- based |
15,298 | 18,647 | 17,612 |
| Market- based |
15,804 | 12,552 | 10,128 | |
| Scope3 | 157,424 | 220,705 | 288,867 | |
| Total (Scope1+2+3) |
Location- based |
172,722 | 239,352 | 306,479 |
| Market- based |
173,228 | 233,257 | 298,995 | |